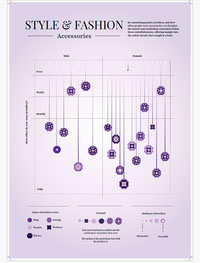
This is a data visualisation graph as part of a group project representing data from a subcategory of the overarching theme "Style and Fashion". We delved into four subtopics namely, Clothing, Accessories, Inspiration and Personality. The sub-topic I was responsible for was Accessories. Within the topic of Accessories I wanted to investigate the relationships between gender, jewellery, and how often people wear accessories, I aimed to decipher the stories and symbolism concealed within these embellishments, offering insight into the subtle details that complete a look.